As I mentioned before, I recently attended the NCTM conference. One of my big take aways was how we should shift the way we teach math. This is nothing new, but for some reason this never really clicked until I attended this conference. Here is the shift that I am talking about.
Currently, and it seems like for long as I have been in school, we teach math by going straight into formal mathematics. For example, if we are trying to teach how to write the equation of a line, we start throwing formulas out left and right and pray to god that our student remember when and how to use each one. We rarely start with informal math problems, that are within a context, that students have a good understanding about. Karim Kai Ani gave a great sports analogy to send this point home at NCTM 13. It went something like this,
“Let’s say you were trying to explain the following situation to someone who has limited knowledge about baseball. What should a runner at first base do if a ball is hit to center field? You would say, the baserunner should take about five steps towards second base, but not go the whole way. If the ball is caught, the runner has to run back to first and tag up before they can advance to second. However, the runner probably shouldn’t go to second because they will probably get thrown out. So the runner should stay at first, unless there are two outs…”
The person listening to this has no idea why the runner at first should try to do any of the things they were just told. They are simply trying to remember when to go to second or when to run back to first. When we teach formal mathematics first, with no contexts, the above paragraph is what it feels like for our students. They have no idea why they are using the formulas we taught them and have no real sense of how they can be used outside of a math classroom. A majority of students tend to struggle with so much initial formal mathematics that what ends up happenings is we start teaching our students ways to get around the mathematics, instead of going in to it. We do this by teaching tricks or work arounds, that we the teacher understand and know why they work, but for the students it is just another pointless rule or step to remember.
Dan Meyer’s talk hit on this same idea. He talked about starting with a perplexing problem and then moving towards the standard. His idea was that we should give students a problem that perplexes them, which in turn should motivate them to learn the math that is required to solve the perplexing problem. This is something that I attempted to do with my Adv. Algebra 2 classes. We were learning how graph to graph sine and cosine functions. In the past, I would have taught this topic by explaining to kids what the amplitude and period are. Show them how the graphs translate. Had them do a bunch of examples. Then, if there was a enough time, I would throw a ferris wheel problem at them and only expect my upper students to get the answer. However, this time around, I tried to start with more informal math (the ferris wheel problem), that was within a context, and then move to the formal mathematics. Here is what I did…
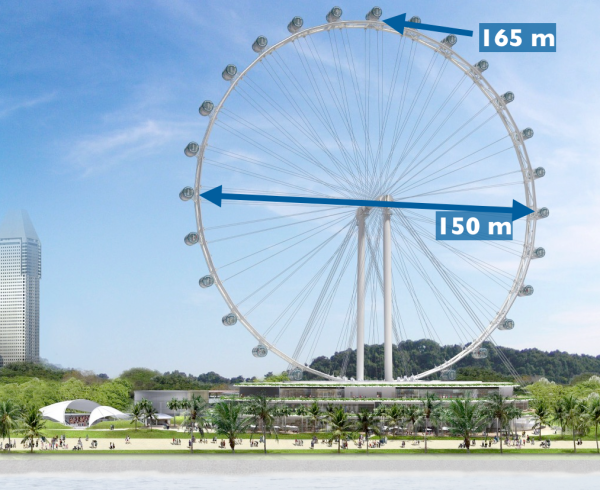
1. I started with www.graphingstories.com and had students try some of the videos. The point of this was to lead them into the next video, which is a time-lapse of the Singapore Flyer (the largest ferris wheel in the world).
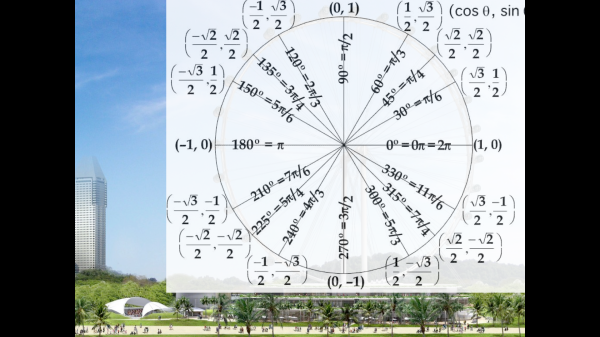
2. Students tended to draw an upside down “V” to model the path of the Ferris wheel. We had a discussion about why the path of the ferris wheel would not be linear. With a little bit of nudging, we ended with a path that resembled a sine curve. I told them we are going to learn a new function that will model the ferris wheel. (I wish there was another way to lead them to the sine curve. I feel like I am going back to teaching formal mathematics first. But, I don’t know how to get my students to make the jump from the path of a ferris wheel to the sine curve without just teaching them the graph of the sine curve first.) I projected the unit circle over the Singapore Flyer to help show students see the connection between the two.
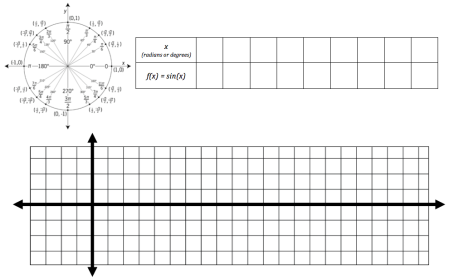
Then, as a class, we used the unit circle to create a table of values for y =sin(x) and plotted them on the graph to reveal the sine curve. Students then created the cosine curve individually. [below is the worksheet/pdf I used]
Even though I taught the formal mathematics of how to graph a sine curve, by starting with the ferris wheel video, I had a context to talk about the graph of the sine curve. I could say things such as, “The sine curve keeps on repeating because the Ferris wheel keeps going around and around and follows the same path.” or “The max and the min will be the same throughout the graph because the ferris has a fixed height.” I felt like this helped students better understand why the sine and cosine curve look the way they do.
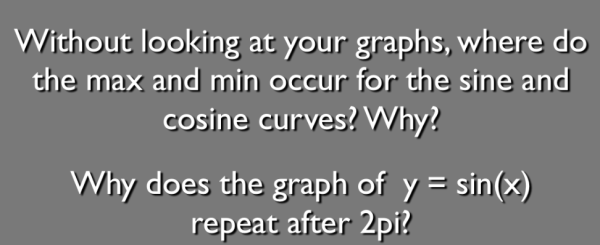
3. This took the full 60 minute period and I ended with the following questions:
(I am not too excited about either of these questions, but they are the best I have right now.)
4. The next day, we went back to the Singapore Flyer problem. I created a Desmos graph, with sliders, and allowed students to manipulate the different parts of the function, y = a sin b(x – h) + k. Their goal was to create a graph that modeled the path of the person in the Singapore Flyer Video.
5. After students found a function that modeled the Singapore Flyer video, we had a class discussion on what each one of the letters in the function, y = a sin b(x – h) + k, did to the graph and how it related to the ferris wheel. Students now had a context for amplitude, period, and the horizontal/vertical shifts. I could now talk about “k” as the distance from the ground to the center of the ferris wheel. Or, “a” as the radius of the ferris wheel. These terms now had meaning as opposed to just a definition written in their notes.
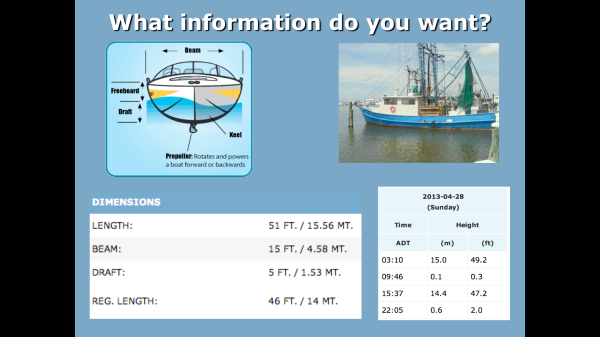
6. I had a second problem for students to try as well. This problem I stole from the NCTM Reasoning and Sense Making Task Library. I did my best Dan Meyer impersonation and found a time-lapse video of the tides at the Bay of Fundy (which has the largest tides in the world!) and asked the question, “When can boats come and go in this harbor?”. This was my so-called Act 1.
7. Act – 2 involved students figuring out what information they needed to solve the problem. Below is the information I found off of the internet.
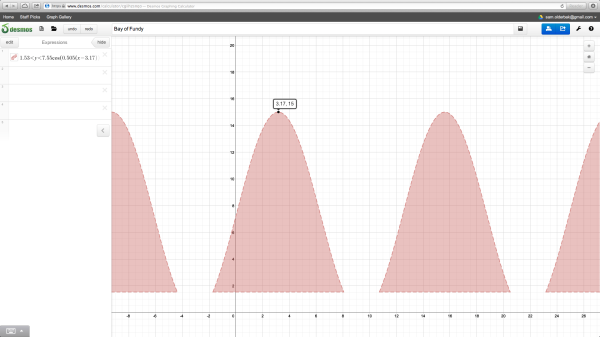
8. Students started by creating a model for the height of the water over time. I did not let students use the sliders in Desmos for this problem. I wanted to check their understanding of amplitude, period, and the horizontal/vertical shifts. The horizontal shift was the most difficult part for the students. We then used Desmos to look at the solutions graphically.
(I don’t really have an “Act 3” for this problem other than just showing students this graph.)
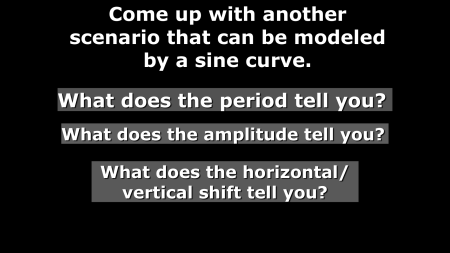
Here are my closure questions.
After doing both of these problems, we then practice graphing standard sine and cosine functions. Students had a much better understanding about the sine and cosine curves. I attribute most of this success to starting with two problems that are with in a context and limiting the amount of formal mathematics that I introduced. Still, I am not sure if this is entirely what Dan Meyer had in mind when he described the process of doing a perplexing problem first before moving to the standard/formal mathematics. I think these problems are interesting, but I don’t think they hit the perplexing level that Dan talks about. For example, I thought the Bay of Fundy problem would have been a lot better if I could have found a video that showed a boat leaving the harbor. Pause the video and say, “At what times will that boat be able to return?”. Then, Act 3 could have been playing the whole video and seeing if the boat returned in the range of times that we predicted. As for the Singapore Flyer problem, I am not sure how I could have done this problem without first teaching them how to graph the basic sine and cosine function. I felt it was necessary that formal mathematics was taught first. However, I think starting with the video of the ferris wheel gave me, as well as my students, context to talk about the different parts of the sine/cosine curve. Regardless, I do think these problems got closer to the idea of presenting new material informally within a context. I am going to continue to work on this through the end of the school year.
[Here are the presentations] Keynote PowerPoint PDF Bay of Fundy Video
